Charts · Crypto made simple
nicspics charts
Crypto made simple. Each chart shows one idea, the mascot reads it for you, and the source is printed on every chart.
Loading data…
Most cards fetch live data in your browser and fall back to a saved snapshot if a feed is blocked. The liquidations panel is a static snapshot: it only updates when the site is redeployed.
📬 Read the latest nicspics Weekly (#1) · Subscribe free
Flagship · Momentum
RSI + MACD, made simple
Last time this happened
Past results don't guarantee future ones. These are real past prices, but a small sample, and the market changes.
The Thermometer
How hot is Bitcoin? (monthly RSI)
Alt Weather Report
Bitcoin season or alt season?
Money Tide
More money in the system vs Bitcoin (year over year)
Leverage Meter
How much borrowed money is betting on BTC?
New to leverage? Read Leverage & liquidations 101.
Liquidations are a static snapshot from our collector and only update when this page is redeployed.
Source: Binance, Bybit, OKX public feeds; partial market.
Charted live · Oct 16, 2026
BTC 1H bull flag: measure the pole, watch the breakout
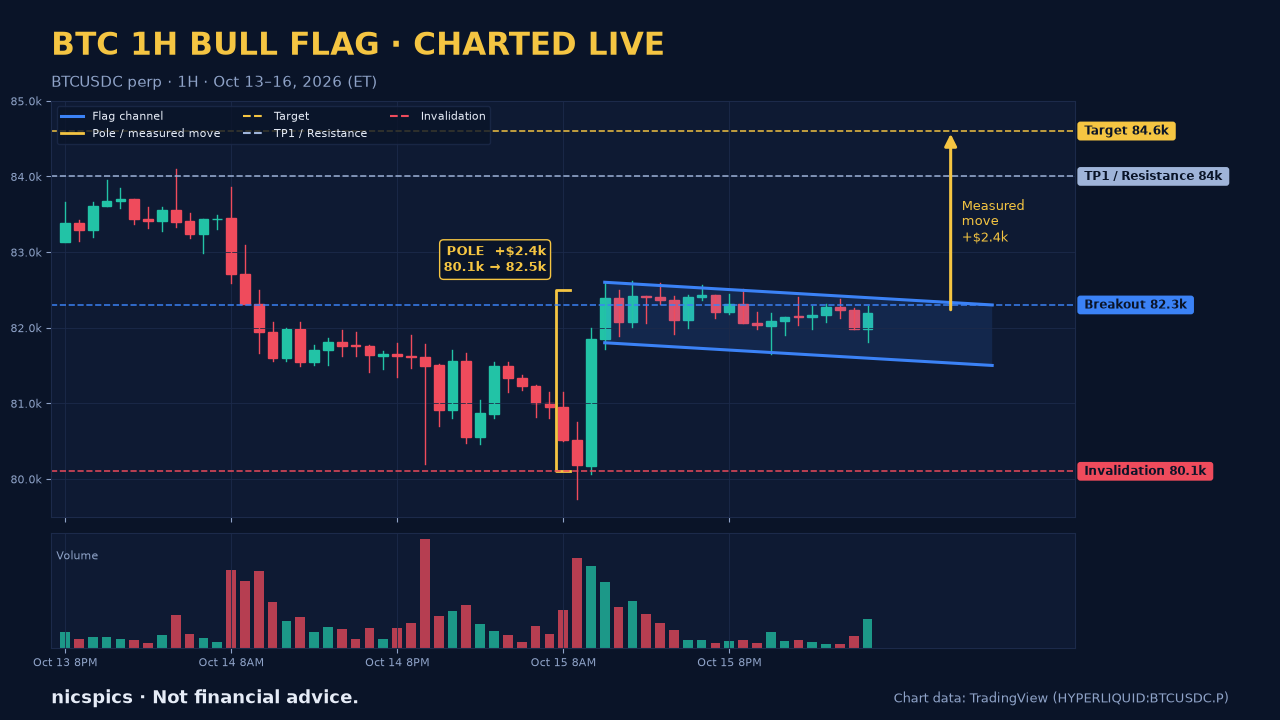
Pole: a fast move up (here roughly $80.1k to $82.4k in two strong hourly candles, 10 and 11 AM ET, Oct 15). Flag: price then drifts down in a tight channel while it "rests".
Measuring: take the pole's height and add it to the breakout point. That gives a rough target, shown as the yellow projection. It's a guide, not a promise.
Breakout and retest: a breakout counts when a candle closes above the top of the channel, ideally on rising volume. Price often comes back to "retest" the old top line as support. If it holds, the pattern stays valid. If price falls back to the base of the pole, the idea is invalidated.
Chart: HYPERLIQUID BTCUSDC perpetual, 1H, charted on TradingView. Educational example only.
Beginner explainer
Leverage & liquidations 101
- Leverage means borrowing to make a bigger bet. At 30x, $100 controls a $3,000 position.
- The catch: a move of only about 3.3% against you (100 ÷ 30) wipes out the whole $100 (a bit less in practice, after fees and maintenance margin).
- That's liquidation: the exchange force-closes the trade and the money is gone.
- In the 24 hours to 12:00 PM ET on Oct 15, 2026, about $937M was liquidated, and 84% were longs betting on up (CoinGlass data).
- Stay safe: use low leverage or none, set a stop loss, and keep your size small.
See how much borrowed money is in the market right now on the Leverage Meter. More in nicspics Weekly #1.
Source: CoinGlass liquidation data, 24h to 12:00 PM ET Oct 15, 2026, via The Crypto Times.
Funding & Long/Short
Who is paying to bet? Funding rates on Binance, Bybit, OKX
Source: loading…
Stablecoin Fuel Gauge
How much dollar fuel is parked in crypto?
Source: loading…
Fear vs Reality
How the crowd feels vs what Bitcoin actually did
Source: loading…
Coinbase Premium
Are US buyers paying extra for Bitcoin?
Source: loading…
On-chain Basics
Is the Bitcoin network healthy?
Source: loading…
Options Mood
Put/call ratio and max pain on Deribit (BTC, ETH)
Source: loading…
Charting tool: TradingView, Paid link (referral): I may earn a commission if you subscribe, at no extra cost to you.