Learn · Adoption framing
Adoption on the S-curve.
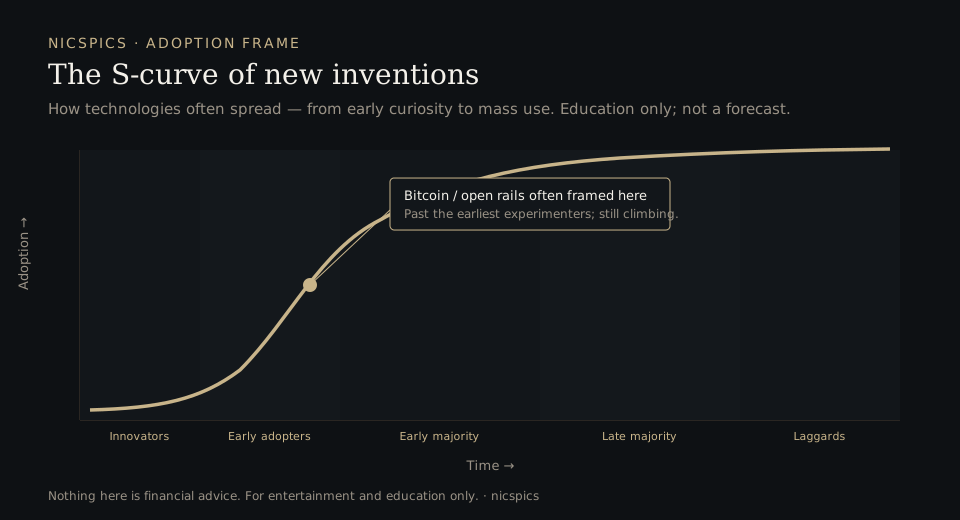
New inventions often follow an S-shaped path: slow start, steep climb, then leveling off. This page explains the classic stages — and how people use that frame when talking about Bitcoin and open blockchain rails. Context only. Not a forecast of returns.
See the chart Web3 S-curve section Tokenization basics
Rogers stages, in plain words
Sociologist Everett Rogers described how ideas spread through a population in Diffusion of Innovations (1962). The shape of adoption over time often looks like an S.
The chart
Bitcoin and open rails as context
Commentators often place Bitcoin, wallets, and public ledgers somewhere on that S-curve: still early for some use cases, further along for others. That framing is a way to talk about participation and infrastructure — how many people use wallets, how many institutions ship tokenized products — not a promise that any asset will rise.
How nicspics uses the S-curve
- Explain stages So beginners can follow news without mistaking hype for homework.
- Separate rails from returns More users or more tokenized products do not equal a buy signal.
- Stay education-first Not financial advice.
What the S-curve is not
- Not a price chart Adoption of a technology and the market price of a token are different questions.
- Not a guarantee Some products never leave the innovator stage. Curves can stall or reverse.
- Not investment timing We do not say when to buy, sell, or hold based on where we think the curve sits.
Related reading
Web3 page · S-curve Tokenization surge Tokenization lesson Social trading
Back to the Learn hub · Get the free weekly note
Sources
- Adoption stages and the S-curve: Everett M. Rogers, Diffusion of Innovations (1962).
- The Bitcoin / open rails marker on the chart is an illustration, not a measured data point.
Sources · checked Oct 8, 2026